import numpy as np
import matplotlib.pyplot as plt
import pandas as pd
from apyori import apriori
A Whole Foods Competitor
Let's say our Company X is a big competitor to Whole Foods ie. specializing in groceries, produce and other consumer products. The company would have quite a huge array of products that are on sale. And very often, management ends up working with simple logical rules to augment business decisions.
But looking at the store from a data-drive point of view is entirely decision. There's a lot of hidden customer behavior to mine - that can help the store offer a better experience for the customer and also improve the bottom line!
from IPython.display import Image
from IPython.core.display import HTML
Image(url= "https://i.insider.com/58ac734c54905756258b5989?width=800&format=jpeg&auto=webp")
Loading the Dataset
This is pretty similar to a cleaned up Point of Sale Dataset. Each row represents a transaction, and the items that were purchased
orders = pd.read_csv('store_data.csv', header=None)
orders.head()
This is order-level data, meaning each row contains the items bought by a customer in a given order. This is hence in a long format
We can note that customers buy from anywhere between 1 and 20 items in a given order
We have about 7.5K records to work with, which is enough for us to implement Association Rules on
Primer to Association Rules
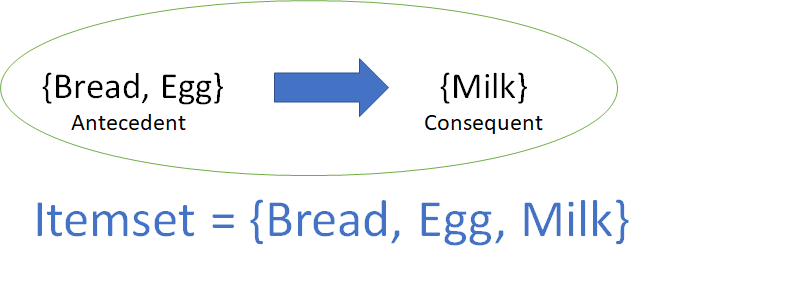
An association rule is a relationship where the one or multiple items co-occur with other items, preferably with a strong significance.
Example: {Bread, Egg} -> {Milk} Someone who buys bread and eggs is highly likely to also buy Milk
The use of association rule mining is widespread - starting from Optimization in Retail Stores to the 'Other Products You May Like' feature on Amazon. In our scenario, we'd like to look at what products are often co-purchased with what items - so we can drive some smart decisions for the store.
But before that, a bit of terminology
Image(url= "https://miro.medium.com/max/1970/1*NoUFBxsokdnw3wrYyVXkgw.png")
Support
This is the number of times a certain itemset appeared in our data. For eg: {Milk} would be extremely common, and hence the support would be high, whereas {French Wine} will have fewer rows and hence lesser support.
We want to mine associations that have a good amount of support.
Image(url= "https://miro.medium.com/max/2590/1*bqdq-z4Ec7Uac3TT3H_1Gg.png")

len(orders)*0.004
Since our dataset is fairly big, even a small support of 0.5% ~~ 30 records will provide us with meaningful associations. But the parameter has to be set by the client based on the requirements
Confidence
This is the likelihood of a person buying item Y given they bought X.
Image(url= "https://miro.medium.com/max/2590/1*E3mNKHcudWzHySGMvo_vPg.png")

Lift
This is the most important parameter we look out for in Association Rules Mining. The lift tells us the likelihood of a customer buying both X and Y over the odds of buying just X
Explain Like I'm 5: If the lift is 5, a customer who has bought X is 5 times more likely to also buy Y
Lo, that's the magic of Association Rules. Simple, Computationally Efficient, but also incredibly meaningful in the insights it offers.
Association Rule Mining - Apriori Algorithm: The How
- We first generate all possible combinations of itemsets from the different transactions we have.
- Pruning: We remove the combinations that have very low support (set a threshold)
- Confidence Threshold: We filter for rules that have sufficient confidence
- Use the rules with the highest lift values!
The apyori package makes this process super simple for us.
Installation: pip install apyori
Data Munging
We need to convert the items purchased in an order into a list of strings for our model to be run
def remover(lit, x):
    try:
        lit = [l for l in lit if l != 'nan']
    except:
        pass

    return lit

orderList = []

for order in orders.itertuples():
    orde = [str(o) for o in order[1:]]
    orderList.append(remover(orde, 'nan'))

orderList[1]
Items
We have everything from vegetables and meat to smoothies and wine.
import itertools
product_list = itertools.chain.from_iterable(orderList)
plist = pd.DataFrame()
plist['item'] = list(set(product_list))
plist
Generating the rules
association_rules = apriori(orderList, min_support=0.0035, min_confidence=0.1, min_lift=2, min_length=2)
association_results = list(association_rules)
Viewing the results in a dataframe
rows = []
for row in association_results:
    obj = row
    item = list(obj[2][0][0])
    support = obj[1]
    to_add = list(obj[2][0][1])
    confidence = obj[2][0][2]
    lift = obj[2][0][3]
    newRow = {'item': item, 'support': support, 'to_add':to_add, 'confidence': confidence, 'lift': lift}
    rows.append(newRow)

rules = pd.DataFrame(rows)
rules.sort_values(by="lift", ascending=False)
Analyzing the rules
We have 588 rules generated based on our constraints of support being 0.35% and confidence being 10%.
We can clearly see some logical rules forming. A customer who buys whole wheat pasta is about 4.8x more likely to also buy olive oil and mineral water. (Everyone loves an Italian night!)
Someone who buys brownies is 2x more likely to buy cake as well.
But some of the not so straightforward rules are more informative to analysts. Light Cream co-occuring with Chicken has a lift of 4.8x. These kind of rules can drive strategy by offering new insight of customer behavior to the management
Now, how can we use these rules to profit?
Loss Leader Pricing and Placement
A loss leader (also leader) is a pricing strategy where a product is sold at a price below its market cost to stimulate other sales of more profitable goods or services. With this sales promotion/marketing strategy, a "leader" is used as a related term and can mean any popular article, i.e., sold at a normal price.
In short
- Offer steep discounts on items you're making loss on anyway
- Customers buy the items related by association rules, which make more money.
- Profit!
Placement We can also alter the locations of items in stores. For example, if we see that Whole Wheat Pasta and Olive Oil co-occur a lot and both generate good revenue - A good idea is to keep the Mineral Water next to these sections, thereby increasing the chances of the customer buying this too.
Mocking some data
We don't have the information for which products are doing well and which ones aren't. So we come up with boolean (True/False) filter for whether the product is generating loss for the store - and generate it randomly.
np.random.seed = 15
plist['loss'] = np.random.randint(0,2, 120)
lossleaders = plist[plist['loss']==1]
winners = plist[plist['loss']==0]
lossleaders.head()
We can see that Sparkling Water, Brownies and Sandwich are among the items that are not profitable for the store
winners.head()
Soup, Candy Bars and Extra Dark Chocolate are incredibly popular at the store and profitable.
Strategy - The Supercharging Part
Now I want to find out the products which are generating loss for us currently, but lead the customer to buy other products along - which are extremely profitable to us.
Explain Like I'm 5 If I give off a loss leader for free, which the customer wasn't anyway going to buy, they are more likely to walk into the store and buy other products which are incredibly profitable for us. Win
Hence, we filter the rules for the same
lossleaders['rules'] = [len(rules[[(item in lhs) & (bool(set(rhs) & set(winners['item']))) for lhs, rhs in zip(rules['item'], rules['to_add'])]]) for item in lossleaders.item]
lossleaders[lossleaders['rules']>0].sort_values(by='rules', ascending=False)
#rules['to_add'] = rules['to_add'].apply(lambda x: remover(x, 'nan'))
rules['no_winners_rhs'] = [len(set(rhs) & set(winners['item'])) for rhs in rules['to_add']]
Making Decisions
rules[[['frozen vegetables'] == r for r in rules['item']]].sort_values(by=['lift'], ascending=False).head()
We can see that a customer who bought frozen vegetables is 2.5x more likely to also buy milk and mineral water, and 2.4x more likely to buy shrimp.
So we can use frozen vegetables as a loss leader as they are not performing well anyway.
Offering a steep discount like 50% off, would mean customers walk into the store's frozen section and buy frozen vegetables, and also pick up shrimp alongside. Profit!
rules[[['olive oil'] == r for r in rules['item']]].sort_values(by=['lift'], ascending=False).head(10)
We can see here that a customer who buys olive oil is 4.1 times more likely to also buy pasta; and 3x more likely to buy spaghetti. (Italian date night at home?)
This can be extremely insightful to the person who plans the layout of the store. A good idea would be to place the olive oil and spaghetti products right next in the pasta aisle, and then offer discounts on the olive oil to get the customer into the store looking for it.
Potential of Association Rules Mining
Given more data, I'd ideally do this analysis with a cost-aware prediction - where we can quantify the revenue gain that can be created by using an Association Rule. There are wide variety of contexts in which Association Rules Mining can be applied - from market basket analysis to picking out the dream team for a football game.
I hope this was an interesting read!